

Inventory turnover ratio (ITR) measures how quickly a business sells and replenishes inventory over a specific period of time. As a common inventory management metric, it helps evaluate inventory movement, operational efficiency, and whether stock is moving too slowly or too quickly.
Because inventory affects cash flow and daily operations, turnover data helps businesses balance stock availability, identify purchasing inefficiencies, support demand planning, and optimize inventory.
In this guide, we will cover:
- What is ITR?
- Why does it matter?
- How to calculate it
- How to interpret ITR calculations
- Improvement strategies and what to watch out for
What is Inventory Turnover Ratio?
Inventory turnover ratio measures how often a business sells and replenishes inventory during a specific time period. It helps organizations evaluate inventory movement efficiency and understand how effectively stock flows through the supply chain.
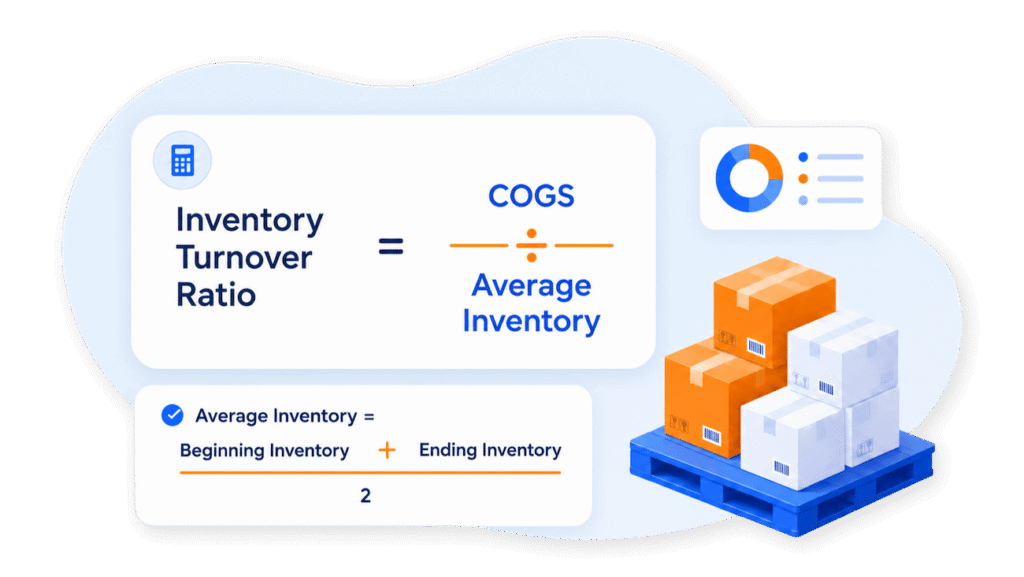
The inventory turnover ratio is calculated using the following formula:
Inventory Turnover Ratio = COGS ÷ Average Inventory
- Cost of Goods Sold (COGS): COGS represents the direct cost of inventory sold during a reporting period, including materials and labor. It is used instead of sales revenue because revenue includes markups and profit margins, which can inflate the ratio and make inventory movement appear stronger than it actually is.
- Average Inventory: reflects the average value of inventory held during the same reporting period. Average inventory is used because turnover is measured across an entire reporting period rather than at a single point in time. Using beginning and ending inventory provides a more representative estimate of inventory levels throughout the period.
Inventory turnover, also called stock turnover, measures inventory movement efficiency, not profitability. The inventory turnover ratio shows how quickly goods move and helps businesses assess inventory quality, buying efficiency, stock shortages, excess inventory, or purchasing inefficiencies. Understanding what inventory turnover does and does not measure helps businesses use the ratio correctly and avoid misleading conclusions.
Inventory Turnover Measure:
Inventory movement efficiency
Replenishment performance
Inventory utilization trends
Inventory Turnover Does Not Measure:
Overall profitability
Gross margins
Service levels
Forecast accuracy
Businesses often assess inventory turnover alongside metrics such as stock availability, service levels, gross margins, and forecasting accuracy to guide replenishment and improve planning. For example, pharmaceutical organizations need careful turnover management because shelf life, expiration dates, and regulatory requirements can make both excess inventory and stockouts costly.
Inventory turnover is only valuable when its insights are used, making it just as important to understand why the metric matters as it is to understand how it is calculated.
Why Is The Inventory Turnover Ratio So Important?
Inventory turnover is more than a reporting metric. Businesses use it to evaluate inventory performance, support decision-making, and understand how effectively inventory aligns with financial, operational, and strategic objectives.
Financial Benefits
Inventory turnover directly affects cash flow and working capital. Inventory that sits too long ties up capital, reduces liquidity, and increases carrying and storage costs, while faster inventory movement improves financial flexibility.
- Improved cash flow
- Reduced holding costs
- Better working capital utilization
- Lower risk of excess inventory
Operational Benefits
Inventory turnover can reveal purchasing inefficiencies, improve procurement decisions, support pricing and sales planning, strengthen forecasting and replenishment, and help businesses avoid both overstocking and understocking.
- Demand forecasting effectiveness
- Procurement planning
- Inventory replenishment decisions
- Warehouse efficiency
- Stock availability management
Strategic Benefits
Inventory turnover helps organizations improve supply chain visibility and business performance by identifying trends across procurement, warehousing, and sales. It also helps businesses reduce overstocking, which ties up capital, and understocking, where shortages can lead to missed sales or operational delays. The ratio matters because it helps businesses turn inventory insights into practical improvements.
Relationship to Other Inventory KPIs
Inventory turnover becomes more valuable when analyzed alongside:
- Days Inventory Outstanding (DIO), also called days sales of inventory
- Gross margin impact
- Service levels
- Stock availability
Together, these metrics provide a more complete picture of inventory performance. DIO shows how long inventory is typically held before being sold, helping teams understand how inventory movement affects cash flow and planning.
How To Calculate Inventory Turnover Ratio
To use the inventory turnover ratio for better financial, operational, and strategic decisions, businesses first need to understand how to calculate it. The ITR calculation requires two inputs from the same reporting period: Cost of Goods Sold (COGS) and average inventory. The calculation breaks down into three simple steps.
Inventory Turnover Ratio = COGS ÷ Average Inventory
Step-by-Step Breakdown
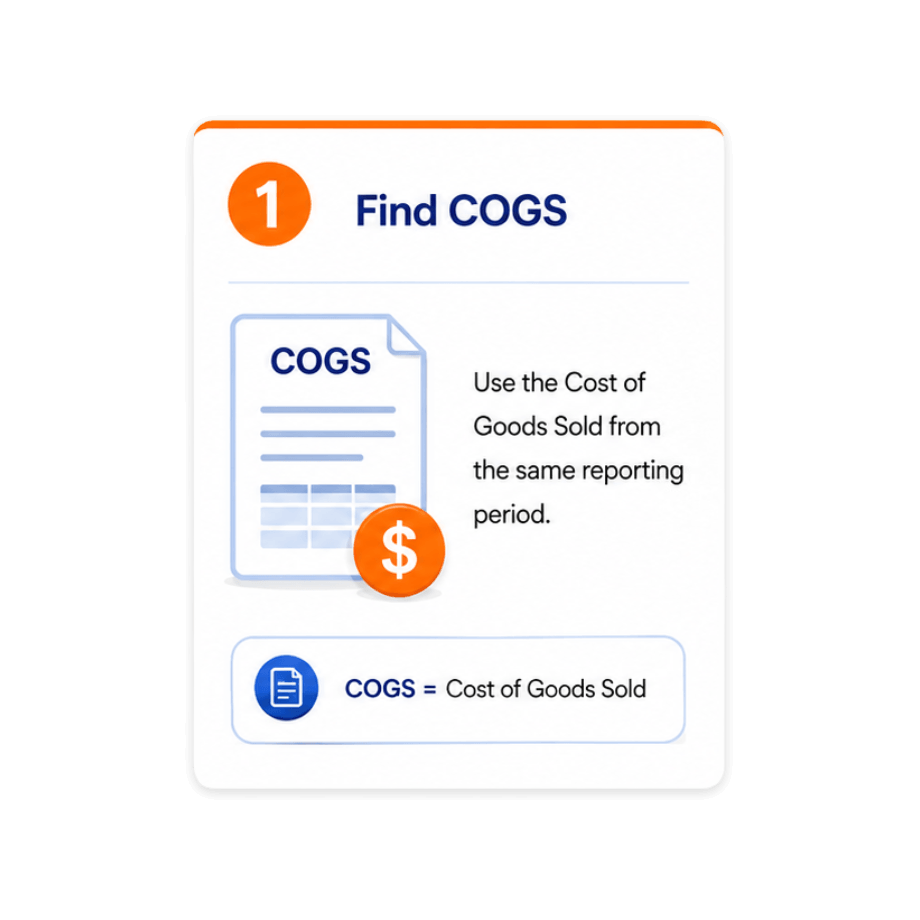
Step 1: Find Cost of Goods Sold (COGS)
Use the COGS value from the company’s income statement for the same reporting period as the inventory values. This keeps the inventory turnover ratio focused on the cost of inventory sold rather than sales revenue or profit margins.
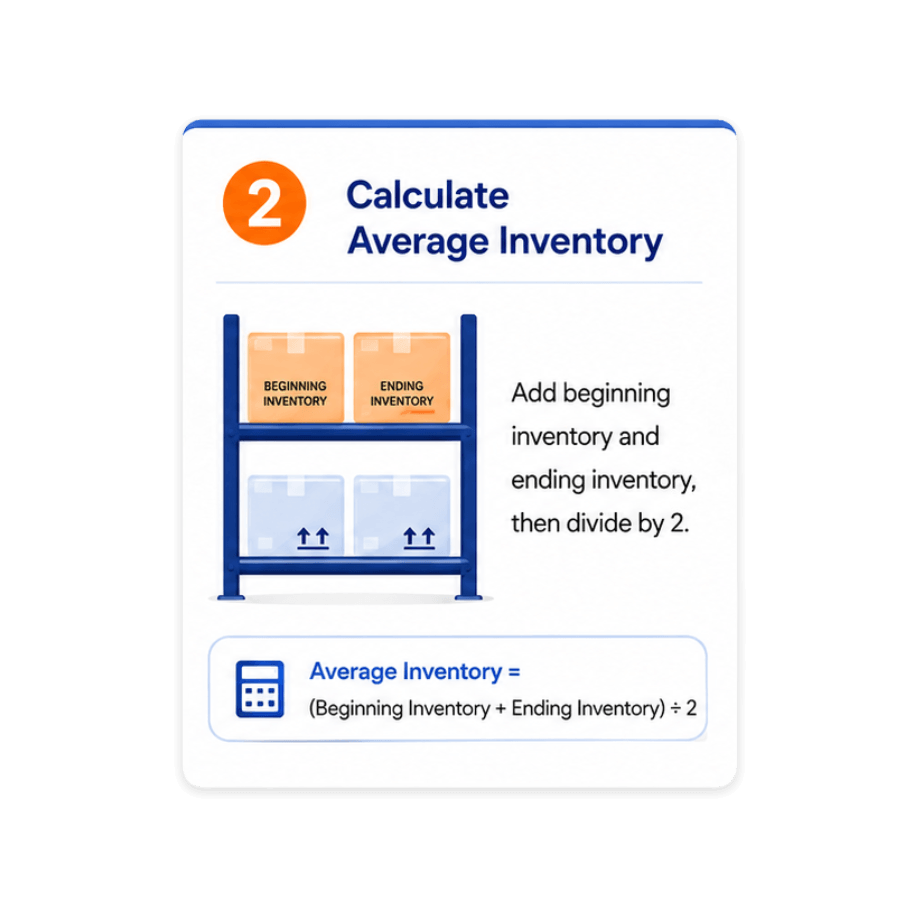
Step 2: Calculate Average Inventory
Average Inventory = (Beginning Inventory + Ending Inventory) ÷ 2
Average inventory uses beginning and ending inventory values from the same reporting period. This helps smooth fluctuations from seasonality, purchasing cycles, and demand changes, providing a more accurate view than a single inventory snapshot. When paired with COGS, it creates a stronger basis for turnover analysis.
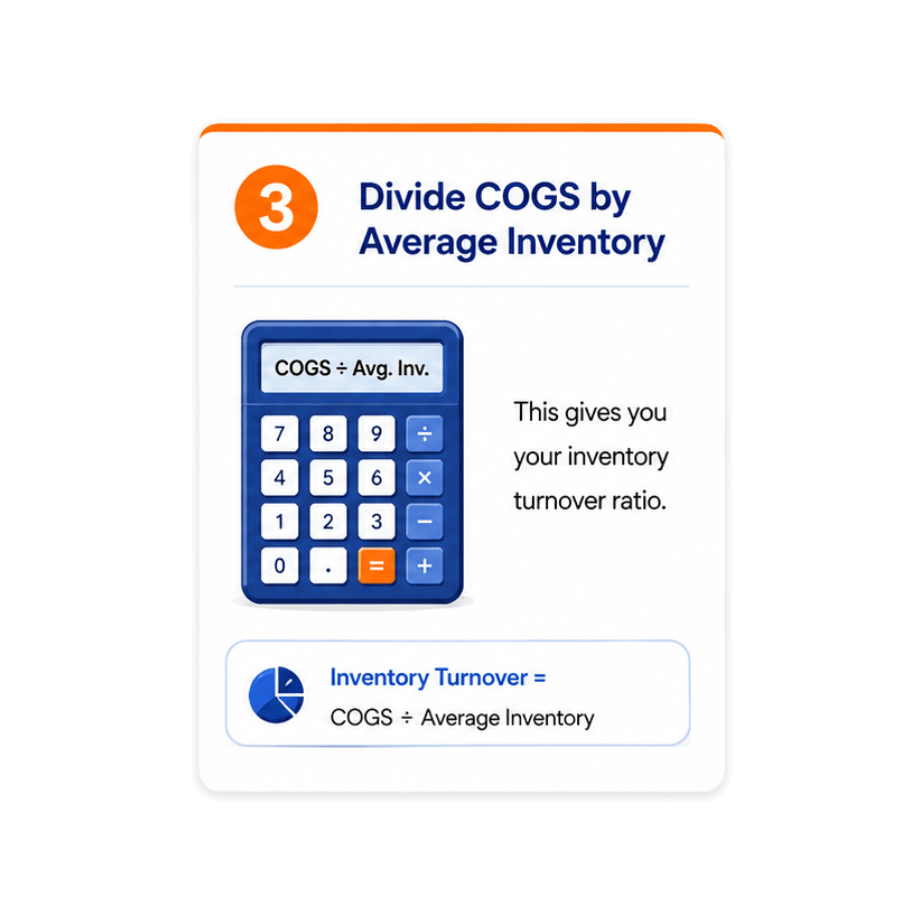
Step 3: Divide COGS by Average Inventory
Divide COGS by average inventory to determine how many times inventory was sold and replenished during a given period.
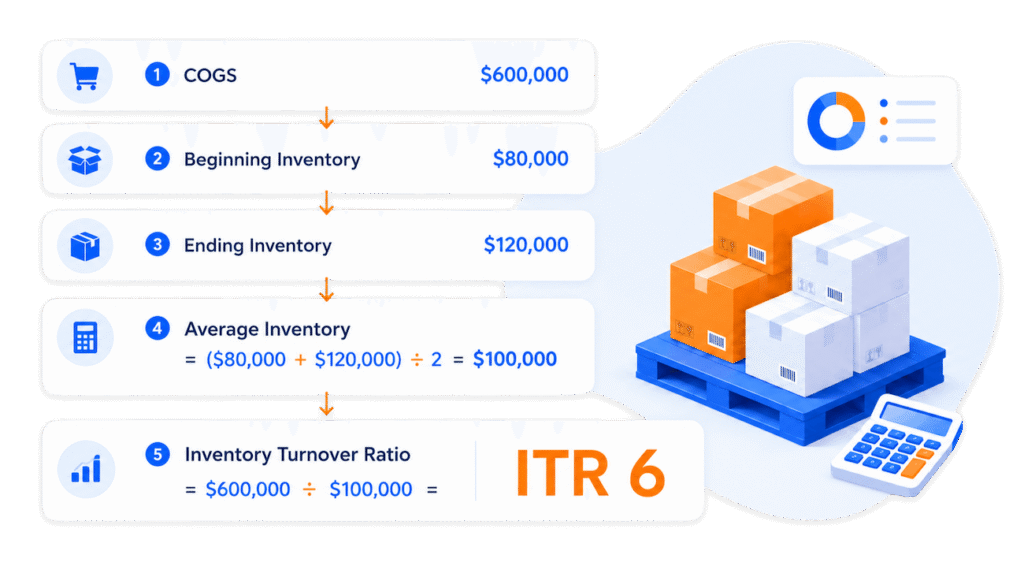
Example Calculation:
- COGS: $600,000
- Beginning Inventory: $80,000
- Ending Inventory: $120,000
Average Inventory: ($80,000 + $120,000) ÷ 2 = $100,000
Inventory Turnover Ratio: $600,000 ÷ $100,000 = ITR 6
A turnover ratio of 6 means the business sold and replenished its average inventory six times during that period.
Businesses may calculate inventory turnover monthly, quarterly, or annually, depending on their operations. More frequent tracking is often useful for fast-moving or seasonal inventory, while consistent monitoring helps identify trends over time.
Important to Note: 6 Common Calculation Mistakes to Avoid
- Using sales revenue instead of COGS
- Using COGS and average inventory from different reporting periods
- Mixing timeframes, such as annual COGS with monthly average inventory
- Using end-of-period inventory value instead of the average inventory value
- Ignoring returns, write-offs, or inventory adjustments
- Comparing ITR results without considering industry or product context
After calculating inventory turnover, the next step is to determine whether the result indicates healthy inventory movement or potential issues, such as excess inventory or stock shortages.
What Inventory Turnover Results Mean
Like any other inventory metric, inventory turnover ratios require interpretation. For example, a ratio of 6 means a business sold and replenished its average inventory about six times during the reporting period. Higher ratios usually indicate faster inventory movement, while lower ratios suggest inventory remains in storage longer.
High Inventory Turnover
A higher inventory turnover generally means products are moving quickly relative to inventory levels, and a higher ratio often reflects strong sales. It is often associated with efficient inventory management, strong demand, and reduced excess inventory.
Benefits of high turnover:
- Improved cash flow through faster inventory movement
- Lower carrying and storage costs
- Reduced risk of obsolete or expired inventory
- Stronger alignment between inventory and demand
- Better liquidity from a higher inventory turnover ratio, provided you still hold enough inventory to meet customer demand
Risks of high turnover:
- Greater risk of stockouts
- Increased strain on suppliers and replenishment processes
- Potential fulfillment delays during demand spikes
- Reduced flexibility if supply chain disruptions occur
- An extremely high ratio can point to insufficient inventory or inadequate inventory, leading to lost sales and missed sales opportunities
Businesses should evaluate high turnover alongside supplier lead times, fulfillment performance, and customer service levels. A very high turnover ratio may show efficient inventory movement, but it can also signal that inventory buffers are too small to support demand consistently, especially during supply chain delays.
Industries that tend to benefit from higher inventory turnover:
- Perishable or expiration-sensitive products where inventory may need to move quickly to reduce waste or expiration risk
- Consumer goods with predictable, high-volume demand
- Retail environments with fast-moving inventory
Low Inventory Turnover
A low inventory turnover ratio means inventory stays in storage longer before being sold. While this is often the result of weak demand, overstocking, or purchasing inefficiencies, a low ratio may also reflect slow or weak sales and, in some cases, leave more unsold inventory on hand.
Risks of low inventory turnover:
- Capital tied up in inventory
- Higher carrying and storage costs
- Increased markdown pressure
- Greater risk of obsolete inventory
- Increased warehouse and storage pressure
- Potential excessive inventory buildup
Lower turnover is not automatically a sign of poor performance. Businesses may keep higher inventory levels to manage long supplier lead times, support project-based work, handle specialized materials, or maintain safety stock. For example, construction firms may hold critical materials to prevent project delays.
Inventory Turnover Benchmarks Vary by Industry
There is no universally “good” inventory turnover ratio that applies to every business, so comparisons should be made against relevant industry benchmarks and industry averages. Inventory requirements differ significantly across industries, products, and operating environments.
Turnover expectations vary by industry. For example:
- Grocery and Consumer Goods: Higher turnover is common as products move quickly and may expire. Retail businesses often use higher turnover benchmarks, around 8-12 turns per year.
- Pharmaceuticals: Businesses must manage turnover carefully due to expiration dates, regulations, and stockout risks, so benchmarks depend heavily on product type and compliance requirements.
- Construction and Industrial Supplies: Lower turnover may be acceptable for long projects, supplier delays, or safety stock. Industrial and manufacturing businesses often use lower benchmarks, around 4-8 turns per year.
Why Context Matters:
Inventory turnover should always be evaluated in context. A ratio considered healthy in one industry may be impractical in another.
Key factors to consider include:
- SKU type: Fast-moving or perishable SKUs usually need higher turnover, while specialized SKUs may move more slowly.
- Product life cycle: Seasonal, new, or declining products can affect demand and turnover.
- Sales velocity: Faster sales usually increase turnover, while slower sales may require closer planning.
- Industry requirements: Regulations, supplier timelines, and storage needs can affect inventory levels.
- Customer service expectations: Businesses may hold extra stock to prevent shortages and meet demand.
High turnover is not always better, and low turnover is not always worse. The ideal inventory turnover ratio balances stock availability, efficiency, and customer demand based on industry and business needs.
Common Inventory Turnover Ratio Mistakes
Inventory turnover is a valuable inventory management metric, but it can be misleading without the proper context. Relying on turnover alone may lead to inaccurate conclusions and poor inventory decisions.
Keep an eye out for these common mistakes when evaluating your inventory turnover ratio:
Mistake 1: Confusing Turnover With Total Sales Velocity
A high sales volume does not automatically mean inventory is being managed efficiently.
Mistake 2: Ignoring Returns, Shrinkage, or Inventory Write-Offs
Inaccurate inventory records can distort turnover calculations and reduce reliability.
Mistake 3: Setting Unrealistic Turnover Targets
Aggressively pursuing a higher ratio is not always better if it increases stockout risk and strains supply chain operations.
Mistake 4: Focusing Only On Turnover While Ignoring Profitability Or Service Levels
Strong turnover does not guarantee healthy margins or customer satisfaction.
Mistake 5: Treating Turnover As The Only Indicator Of Inventory Health
Turnover should be evaluated alongside metrics such as stock availability, service levels, gross margins, relevant industry benchmarks, and market demand.
Mistake 6: Ignoring Seasonality
Seasonal demand fluctuations can make turnover appear unusually high or low during certain periods, potentially leading to inaccurate conclusions if results are evaluated in isolation.
Inventory turnover is most valuable when viewed as a part of a broader inventory performance strategy. Focus on trends over time, evaluate results within the proper business context and overall business performance, and use turnover alongside other key inventory metrics to support decision-making.
How To Improve The Inventory Turnover Ratio
Improving inventory turnover requires balancing inventory availability with operational efficiency. The goal is not simply to increase turnover, but to align inventory levels more closely with demand to improve overall business performance. We’ve curated a list of key strategies proven to improve your ITR:
Improve demand forecasting. Historical sales data, seasonality, and demand patterns help businesses make more accurate purchasing decisions. Monitoring market demand and sales performance also supports better adjustments and reduces excess inventory.
Implement just-in-time inventory practices. Replenishing inventory closer to demand can reduce carrying costs and excess stock when supported by reliable suppliers and forecasting.
Categorize inventory using ABC analysis. Prioritizing high-value or fast-moving SKUs allows businesses to focus resources where they have the greatest operational impact.
Strengthen supplier relationships. Shorter lead times and more reliable replenishment reduce the need for excess safety stock, help businesses meet customer demand, avoid supply chain delays, and support healthier inventory turnover.
Review pricing and promotional strategies. Discounts, bundles, and targeted promotions can help move slow-selling inventory and free up warehouse space. A well-timed pricing strategy can also address sluggish stock more directly.
Automate inventory management. Software can provide real-time inventory visibility, support forecasting, and automate replenishment decisions before inventory issues become larger problems.
Consistent monitoring will help your business maintain healthy inventory turnover, identify issues sooner, manage inventory effectively, and improve purchasing decisions.
Tools And Software To Track Inventory Turnover
Tracking inventory turnover manually becomes more difficult as inventory complexity grows. Real-time inventory visibility platforms like Clear Spider help organizations improve inventory management processes, monitor turnover trends, and make faster purchasing and replenishment decisions.
Why Technology Matters
Modern inventory systems provide real-time visibility into inventory movement, helping businesses:
Monitor turnover trends
Improve inventory accuracy
Identify slow-moving inventory earlier
Respond faster to inventory issues
Use Analytics dashboards to identify both slow-moving and fast-moving inventory, monitor turnover trends, and spot potential inventory issues before they affect operations.
From Data to Decisions
Inventory turnover becomes more useful when connected to ERP, WMS, procurement, forecasting, and accounting systems. Clear Spider’s software seamlessly integrates data to improve inventory visibility, optimize purchasing decisions, automate replenishment, and support more accurate ITR calculations by syncing accounting and inventory data.
Inventory Turnover as Strategic Intelligence
The value of inventory turnover extends beyond the calculation itself. When analyzed alongside procurement activity, warehouse operations, forecasting data, and financial information, turnover becomes a tool for smarter inventory planning and decision-making.
Clear Spider helps organizations turn inventory turnover data into actionable inventory decisions. With real-time visibility, inventory tracking, analytics dashboards, and connected replenishment workflows, businesses will identify slow-moving stock earlier before it becomes a high stockout risk, improve forecasting, and make more confident purchasing decisions.